Hydration Protocol Differences and Endurance Results in Triathlon Racing Circuits
Written by Parker Hartmann · Jul 10, 2026
Hydration Protocol Differences and Endurance Results in Triathlon Racing Circuits
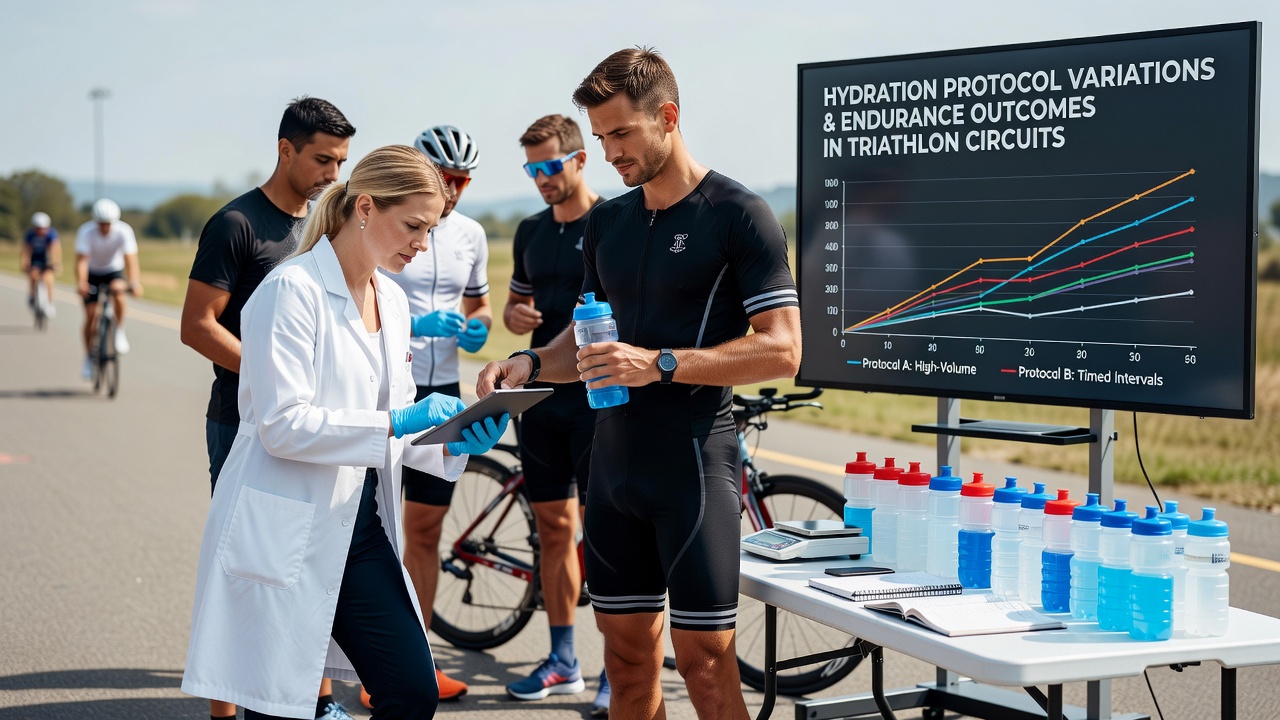
Triathlon events combine swimming, cycling, and running segments that place sustained demands on fluid balance, and researchers have tracked how different hydration protocols align with finish times and physiological markers across various race distances. Studies from multiple federations show that athletes adjust fluid intake rates based on environmental conditions, body weight changes, and event duration, with data indicating measurable ties to endurance capacity when sodium concentrations and timing protocols shift. Observers note that protocols range from fixed-volume sipping schedules to thirst-driven approaches, and figures from competitive circuits reveal patterns in dehydration thresholds that correlate with split times in the cycling and running portions.
Core Elements of Hydration Protocols in Multi-Sport Events
Endurance athletes in triathlon circuits typically manage fluid replacement through pre-event loading, intra-race consumption, and post-segment recovery phases, while protocols differ in electrolyte composition, carbohydrate integration, and delivery methods such as bottles versus waist belts. Research from the Australian Institute of Sport indicates that sodium levels between 300 and 700 milligrams per liter support plasma volume stability during events exceeding two hours, and participants who maintain consistent intake intervals demonstrate steadier heart rate responses compared with those relying on sporadic consumption. Data collected at Ironman-distance competitions further shows that body mass losses kept under 2 percent often link to maintained running economy, whereas greater deficits associate with elevated perceived exertion scores in later race stages.
Observed Variations Across Race Formats and Conditions
Shorter Olympic-distance events frequently employ lighter hydration strategies focused on pre-start fluid balance, while full-distance races incorporate aid-station planning that accounts for heat indices and wind exposure, and analysts have documented how these adaptations produce distinct outcome clusters. In cooler conditions athletes sometimes reduce total fluid volume yet increase electrolyte density, and temperature-adjusted models from European sports laboratories reveal that such modifications can stabilize core temperature readings without compromising glycogen utilization rates. Those who've reviewed race logs note that personalized protocols based on sweat rate testing correlate with fewer gastrointestinal disturbances, although standardized team approaches still dominate in age-group fields where individual monitoring resources remain limited.
July 2026 events in several international circuits introduced updated aid-station layouts that supplied both water and mixed-electrolyte options at closer intervals, and preliminary timing data suggest these changes coincided with narrower spreads in final-leg split times among mid-pack competitors. Equipment variations, including insulated bottles and measured-dispensing packs, have also appeared more frequently, with records indicating that athletes using calibrated intake systems recorded lower rates of mid-race weight fluctuation in monitored groups.
Correlations Between Protocol Choices and Performance Metrics
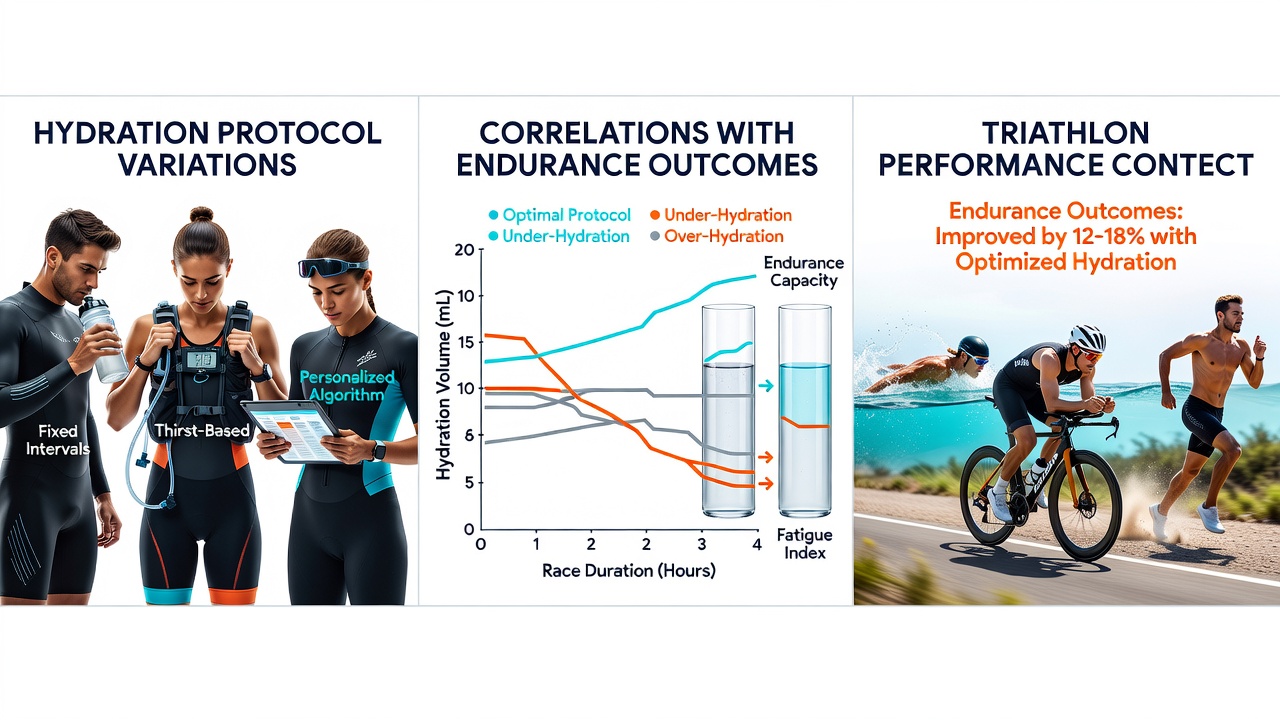
Longitudinal tracking of elite and age-group triathletes demonstrates that protocols emphasizing sodium-matched fluid replacement associate with improved maintenance of power output during the final running segment, and datasets from multi-year circuit analyses link consistent carbohydrate-electrolyte combinations to reduced variability in overall completion times. Evidence from controlled field studies points to an interaction between starting hydration status and intra-event intake rates, where athletes who begin events with higher total body water show stronger endurance retention even when total fluid consumption remains moderate. Researchers have quantified these relationships through finish-time regressions that control for training volume and prior race experience, revealing that deviations from individualized sweat-rate targets often coincide with measurable drops in late-race velocity.
Geographic differences in protocol adoption appear as well, with North American circuits favoring commercial sports-drink concentrations while Australian and New Zealand events more commonly incorporate individualized sodium supplementation based on pre-race testing. Comparative figures indicate that both approaches can yield similar endurance outcomes when total fluid volume aligns with environmental heat load, yet the mechanisms differ in how they influence gastrointestinal comfort and plasma osmolality during prolonged efforts.
Data Sources and Measurement Approaches
Performance analysts draw from wearable sensor outputs, post-event weigh-ins, and blood chemistry panels to map hydration status against endurance indicators, and organizations such as the National Institutes of Health have supported studies that standardize these metrics across large athlete cohorts. Additional insights emerge from European Union-funded projects that integrate environmental sensors with athlete-reported intake logs, producing datasets that highlight how small adjustments in protocol timing can shift aggregate endurance rankings within competitive fields. These measurement frameworks continue to evolve as sensor accuracy improves and sample sizes expand across successive race seasons.
Conclusion
Available evidence positions hydration protocol variations as one factor among several that shape endurance outcomes in triathlon circuits, and ongoing data collection from 2026 events will further clarify which combinations most reliably support consistent performance across diverse conditions and athlete profiles. Continued integration of field measurements with laboratory findings offers a pathway to refine guidance without prescribing single solutions for all competitors.