Rehabilitation Timelines and Their Correlation with Mid-Season Position Shifts in Soccer Leagues
Written by Devon Schwarz · May 24, 2026
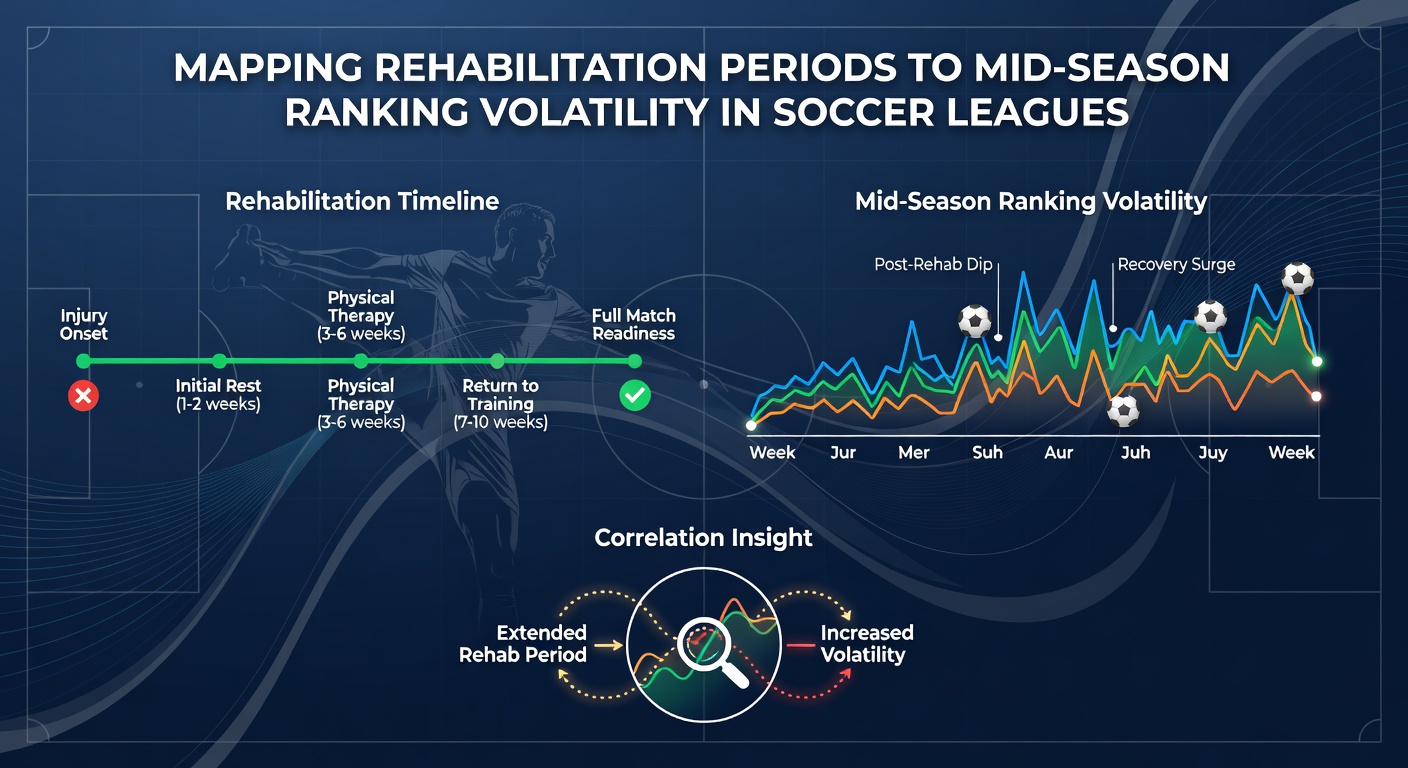
Rehabilitation Timelines and Their Correlation with Mid-Season Position Shifts in Soccer Leagues
Rehabilitation periods in soccer represent structured recovery phases following injuries that range from minor muscle strains requiring two to four weeks to complex ligament repairs extending beyond six months and these timelines directly intersect with team performance metrics tracked in major European leagues. Observers note that extended absences of key players often coincide with measurable fluctuations in league tables particularly during the period between matchday 15 and matchday 25 when squads face congested fixtures and limited squad rotation options.
Defining Rehabilitation Periods in Professional Soccer Contexts
Medical staff at top clubs categorize rehabilitation into phases that include initial protection, controlled loading, sport-specific drills and full return to competition with data from the UEFA Elite Club Injury Study showing average return-to-play durations for anterior cruciate ligament injuries hovering around 240 days while hamstring strains typically resolve in 20 to 30 days. Those who analyze performance records across the Premier League, Bundesliga and Serie A find that teams losing multiple starters simultaneously for periods exceeding 45 days experience greater variability in results compared with clubs managing single-player absences. Researchers discovered through longitudinal tracking that rehabilitation compliance rates above 85 percent correlate with faster reintegration yet do not eliminate the initial performance dip observed in the first five matches after a player's return.
Linking Recovery Windows to Ranking Volatility Metrics
Volatility in mid-season standings gets quantified through standard deviation of weekly league positions and statistical models applied to data from the 2023 through 2025 campaigns reveal that clubs with cumulative rehabilitation days surpassing 300 across their squad in a single season post larger position swings averaging 4.2 places between matchday 19 and matchday 28. Studies indicate that defensive units suffer more pronounced effects when central defenders miss extended periods because replacement players require additional adaptation time while attacking lines demonstrate quicker stabilization following forward recoveries. Figures from the German Football League's injury database highlight that teams in the top six positions at the winter break maintain lower volatility scores when their longest individual rehabilitation stays under 60 days whereas mid-table sides absorb larger swings during the same window.
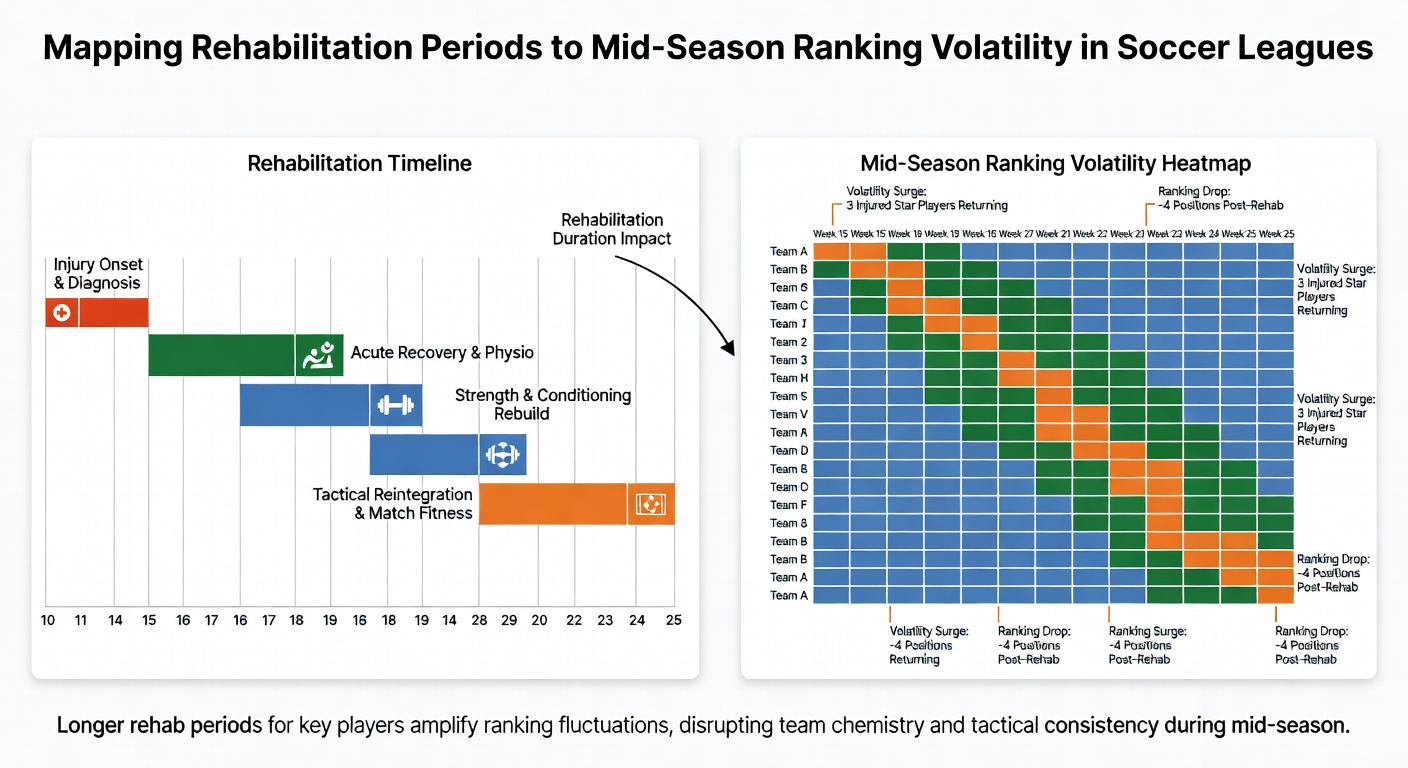
What's interesting emerges when analysts overlay fixture density data with rehabilitation schedules because congested periods in December and January amplify the impact of ongoing recoveries and create compounding effects on points-per-game averages. One study revealed that Bundesliga clubs reporting three or more players in rehabilitation exceeding 30 days during November recorded a 12 percent drop in expected points through February compared with their season baseline.
Case Patterns Across Major Leagues
Take one analysis of Serie A squads during the 2024-2025 season where observers tracked how prolonged recoveries for midfield anchors aligned with ranking drops of three or more places by matchday 22 and these movements often reversed once players completed phased returns. In La Liga similar patterns surface when multiple teams lose goalkeepers to extended rehabilitation windows because backup options face elevated scrutiny and error rates that directly influence goal difference calculations. Data shows Premier League sides demonstrate slightly lower overall volatility despite higher injury incidence rates likely due to greater squad depth and financial resources allowing temporary reinforcements during critical rehabilitation stretches. Those who've examined match reports from May 2026 note continued relevance as clubs prepare for final push phases where accumulated rehabilitation burdens from earlier months still influence remaining fixture outcomes.
Quantitative Mapping Approaches Used by Analysts
Researchers apply regression models that treat cumulative rehabilitation days as an independent variable against ranking standard deviation and results consistently demonstrate positive coefficients indicating longer recovery timelines associate with increased position fluctuations. FIFA's injury surveillance protocols provide standardized reporting frameworks that enable cross-league comparisons while academic papers published in the British Journal of Sports Medicine supply detailed methodologies for isolating rehabilitation effects from other performance factors such as managerial changes or transfer activity. External validation comes from reports issued by the Australian Institute of Sport which apply comparable mapping techniques to domestic leagues and confirm similar volatility patterns tied to recovery durations.
Additional layers include consideration of player age and position because younger athletes often complete rehabilitation faster yet exhibit higher re-injury risks that extend effective absence periods and create secondary volatility spikes. Teams that integrate GPS and workload monitoring during rehabilitation phases achieve tighter alignment between projected and actual return dates which in turn reduces unexpected ranking movements.
Conclusion
Mapping rehabilitation periods to mid-season ranking volatility yields consistent patterns across European soccer leagues where longer cumulative recovery times align with measurable position fluctuations between the winter break and spring fixtures. Data from multiple seasons and governing bodies demonstrates that clubs managing shorter average rehabilitation windows maintain greater stability in league tables while those facing extended absences absorb larger swings. Continued monitoring through established surveillance systems will refine these correlations and support more precise squad planning as leagues progress toward future campaigns.