Sensor Technology Illuminates Team Positioning Patterns Across International Tournament Cycles
Written by Willa Jenkins · Jul 19, 2026

Sensor Technology Illuminates Team Positioning Patterns Across International Tournament Cycles
International tournament cycles generate massive volumes of movement data, and sensor arrays now capture details that traditional scouting often overlooked. Wearable devices, pitch-embedded trackers, and optical systems combine to map player locations at frequencies reaching 100 times per second, according to studies coordinated by the Australian Institute of Sport. These streams reveal how squads adjust spacing, depth, and lateral coverage as matches progress through group stages into knockout rounds.
Core Sensor Systems Driving the Data
Global positioning system units, local positioning systems, and inertial measurement units sit at the center of current collection efforts. Teams outfit players with lightweight vests that integrate accelerometers and gyroscopes, while fixed cameras triangulate positions on the field. The resulting datasets allow analysts to reconstruct every pass, press, and recovery run with precise coordinates, and federations in Europe and North America have standardized protocols for sharing anonymized files across cycles.
Observed Shifts in Defensive Blocks
During the 2022 FIFA World Cup cycle, sensor records showed many squads narrowing their defensive width by an average of 4.2 meters after the 60-minute mark. Similar compression appeared in UEFA Euro 2024 group matches, where teams facing elimination adjusted their back lines closer to the penalty area while maintaining higher full-back positioning on the opposite flank. Researchers tracking these movements noted that the adjustments correlated with reduced high-intensity runs rather than deliberate tactical orders, suggesting fatigue signals influenced spacing choices more than coaches realized at the time.
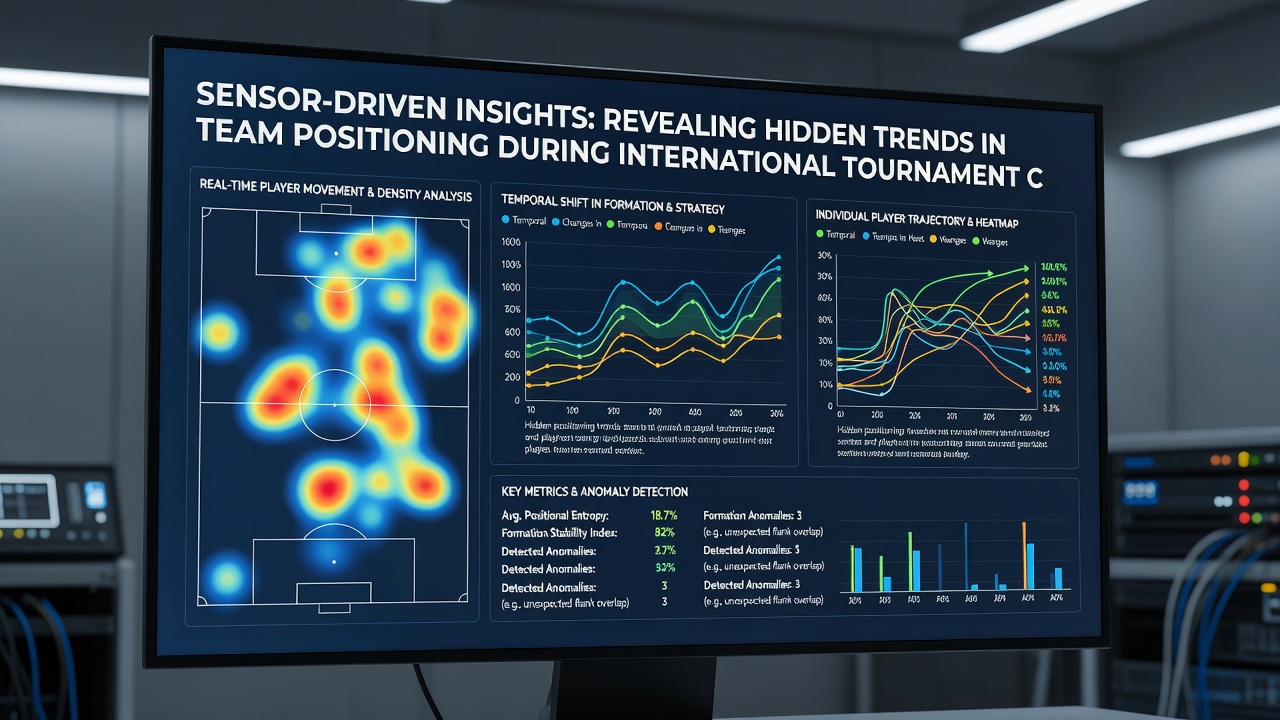
Data from the same events also highlighted a rise in zonal rather than man-oriented pressing triggers. When attackers received the ball in central channels, sensor-derived heat maps indicated that midfield units dropped an additional 3 meters deeper compared with opening matches, creating compact pockets that funneled play wide. These patterns repeated across multiple federations, pointing to shared responses to accumulating physical load rather than isolated coaching philosophies.
Offensive Spacing and Transition Triggers
Forward lines exhibited equally measurable changes. In CONMEBOL Copa América tournaments, sensor logs captured an increase in staggered attacking shapes after halftime, with one wide forward tucking inside while the opposite striker held width. The shift coincided with measured declines in sprint frequency, allowing teams to sustain pressure without exhausting wide channels early. Observers reviewing multiple cycles noted that squads reaching semifinals maintained these staggered structures longer than teams eliminated in earlier rounds.
Transition moments proved especially revealing. Accelerometer spikes combined with positional timestamps showed that successful counter-pressing sequences often began when at least three players occupied a 10-meter radius around the ball within two seconds of turnover. Teams that failed to achieve this density lost possession again at higher rates, and the metric appeared consistently across both men's and women's international brackets.
Preparing for the 2026 Cycle
With the FIFA World Cup 2026 scheduled for June and July across North American venues, federations have already begun layering 2022 and 2024 datasets to model expected physical decay curves. Canadian and Mexican training centers now integrate altitude-adjusted positioning benchmarks, since several host cities sit above 1,500 meters. Early simulations suggest teams may widen their defensive blocks slightly in thinner air to compensate for slower recovery runs, a hypothesis that will face direct testing once matches begin.
Academic partners at institutions such as the University of Queensland continue publishing open-access papers that compare positioning entropy across tournament phases. Their latest release examined 14,000 player-minutes from recent cycles and found that entropy, a measure of positional unpredictability, dropped 11 percent between group and knockout stages for most squads. Lower entropy correlated with fewer goals conceded yet also fewer goals scored, illustrating the trade-off many coaches accept when advancing deeper into competitions.
Integration With Coaching Decisions
Coaching staffs receive processed sensor outputs through tablet dashboards during matches and review full datasets in post-match debriefs. Real-time alerts flag when a player's average distance from teammates exceeds historical norms for that fixture minute, prompting substitutions or formation tweaks. Several national federations now require sensor compliance for all players selected in final squads, ensuring consistent datasets across preparation camps and tournament windows.
Equipment upgrades continue at regular intervals. Newer local positioning systems achieve sub-10-centimeter accuracy indoors and outdoors, removing previous gaps that existed when teams trained in covered facilities. The European Olympic Committees have funded pilot programs that merge these refined location streams with heart-rate variability readings, allowing staff to correlate positional discipline with physiological stress markers during extended tournament schedules.
Conclusion
Sensor networks have moved from novelty to standard infrastructure across international tournament cycles. The accumulated records now supply federations with objective benchmarks for spacing, pressing triggers, and fatigue-driven adjustments that were previously discussed anecdotally. As the 2026 cycle approaches, continued refinement of these tools will likely sharpen how teams prepare and adapt on the field, turning granular movement data into a core element of competitive planning.